

Sekulovski, D.1, Perz, M.1, Stephan, A.2
1 Signify Research, Eindhoven, THE NETHERLANDS
2 Signify ONCE Innovation, Plymouth, USA
dragan.sekulovski@signify.com
Abstract
We propose a measure of temporal light quality that could be used to design flicker-free light sources, as perceived by birds. It can be applied to, among others, the poultry industry to reduce the negative impact of the modulated light on chicken health and well-being. The model is built by modifying an existing human flicker visibility model considering properties of bird vision. We discuss the implications of the model responses on the temporal quality of historical and currently used light sources.
1.1 Introduction
The mass adoption of LEDs in all electric lighting application areas has brought an increased emphasis on the perception of light that changes over time (Temporal Light Modulation, TLM) and the multitude of unwanted perceptual effects due to modulated light (Temporal Light Artifacts, TLAs). CIE has been at the forefront of new development in this area. CIE TC 1.83 has been working on classification and definition of different TLAs (flicker, the stroboscopic effect, and the phantom array effect) as well as the developments of models for predicting their visibility (CIE 2016). All this development has, however, been concentrated on the effects of TLM on human perception. For some economically important animals, namely most mammals kept as livestock, anatomical and physiological data give confidence that the human centric TLA models can be used. Not surprisingly, however, the translation of these models to ones that predict the perceived quality of light for other animals can be far from trivial.
One of the animals often reared under electric lighting is the domestic chicken. To the best of our knowledge, there is no accepted standard way of quantifying the temporal quality of light for applications in the poultry industry and in the wider area of electric lighting for birds. This paper aims to remedy that by proposing a measure of temporal light quality for birds based on existing models of human temporal light perception while accounting for differences between human and bird vision.
1.1 Human temporal quality of light
CIE TC 1.83 defines three different types of TLAs, depending on the motion of the observer or the objects in the environment. Two of those effects, the stroboscopic effect and the phantom array effect, are caused by additional movement in the environment or by the eye of the observer. These effects can cause discomfort and decreased performance in some visual tasks, but their health and well-being effects are not clear.
The last effect, flicker, is the most critical. It is commonly known that it can be irritating, but also it can result in an onset of a migraine (Hay et al., 1994), it can lower task performance (Green 1995) and for sufferers or photosensitive epilepsy, it might cause serious negative health effects (Debney, 1984). For humans, the visibility of flicker is limited to frequencies of up to around 80 Hz, with the probability of critical health effects being significant only below a frequency of around 50 Hz (Perz et al. 2017). Due to its critical nature, the CIE as well as national regulatory and performance standards require TLMs to be limited to amounts that do not produce any visible flicker.
The visibility of a certain temporal modulation as flicker depends on many environmental and observer parameters. Among the most important are the illuminance level on the eye of the observer (de Lange 1958); size and shape of the flickering stimulus (Kelly 1959); waveform (Levinson 1960); position of the flickering stimulus in the visual field (Perz et al. 2010); mental load (Perz et al. 2010); and the duration of the modulation (Shady et al. 2004).
Multiple models of flicker visibility exist in literature. Starting from the pioneering work of Kelly (1961) and de Lange (1961), the use of frequency analysis and sensitivity to sinusoidal modulations has been used as a basis of modelling flicker visibility. The sensitivity curve for a given set of parameters can be fitted into parametric model. Examples of such models include the ones proposed by Barten (1999), Fredericksen et al. (1998), and Rovamo et al. (1999). To determine the visibility of complex waveforms, the frequency content of the waveform needs to be scaled to correspond to the sensitivity of the visual system. This can be done both in the frequency domain as well as in the time domain. CIE TC 1.83 (CIE 2016) recommends the use of a frequency domain method (like FVM, Perz et al. 2017) for periodic flicker and cases where the phase information between different component frequencies can be ignored. In other cases, a time domain method (like pstLM, IEC 2010) is recommended.
1.2 Birds and flicker
Temporal characteristics of birds’ visual perception are not as well understood as those of humans. However, several psychophysical studies have been designed and reported in the literature, typically using a concept of the Critical Flicker fusion Frequency (CFF, being a frequency above which light modulation is not detectable). CFF measurements methods used most often are psychophysical (behavioural) or physiological (electroretinograms, ERG).
It has been demonstrated that birds’ CFF is higher than humans CFF (i.e., 80 Hz). However, there is little agreement on the specific values. In the case of the domestic chicken, behavioural experiments have demonstrated CFFs of up to 105 Hz (Nuboer et al. 1992). Some behavioural responses to high frequencies only occur in brighter light, for instance the increased CFF of chicken is especially pronounced above 50 lx with the CFF at 100 lux being 87 Hz (Taylor et al. 2002), showing that CFF is light intensity dependent. Intensity dependence of CFF is also present when measured by an electroretinograms (ERG) of normal laying hens, with the maximum frequency discerned at 119 Hz (Lisney et al. 2012). Lisney et al. (2012) also noted a large individual variation between the birds measured. A surprising effect of the presence of UV light on the CFF of chicken has been also reported (Rubene 2010). Other birds have even higher CFFs, with raptors up to 129 Hz (Potier 2020), and some passerine species (blue tit and flycatcher) up to 145 Hz.
As with humans, visible flicker might negatively impact the health or well-being of birds. These have been estimated using behavioural responses, such as preference and activity (e.g., eating, jumping), and by measuring hormone levels, such as corticosterone, which is an indicator for stress. Not all studies yield consistent results, however it is apparent that exposure to light modulated at frequency of 100 Hz has negative impact on starlings, relative to 30 kHz light. In 100 kHz light starlings had lower basal corticosterone levels, and higher levels of myoclonus (involuntary muscle spasms) and preening compared to 30 kHz light. 100 Hz light also led to reduced jumping, eating, drinking and bill wiping in starlings. This indicates chronic stress, which continued after exposure to relatively low-frequency light modulation (Evans 2012). For layer hens, no preference to either high frequency fluorescent light or incandescent light has been reported (Widowski and Duncan 1996, Widowski et al. 1992). In broiler chicken, Boshouwers et al. (1992) reported an increased activity in high frequency fluorescent light compared to low frequency, but this did not result in measurable differences in total energy expenditure. Literature on the effect of temporal modulation on visual tasks of birds is even more scarce. For layer hens, the frequency of the light above 100 Hz did not have an influence on the accuracy of jumps between perches (Moinard 2004).
2. Building an avian flicker visibility measure
The basic part of any flicker visibility measure is the response of the visual system being modelled to the basic building blocks of modulation, sinusoids. This response is typically characterized using a sensitivity curve. The points on the sensitivity curve show the inverse modulation amplitude of a just-visible sinusoid at a range of frequencies. The visibility threshold and thus the sensitivity curve is typically measured using psychophysical or physiological experiments. These experiments are time consuming and as such are seldom done for non-human animals. Flicker sensitivity curves have been measured for turtles and pigeons (Graf, 1973), goldfish (Bilotta, Lynd, & Powers, 1998), cats (Loop & Berkley, 1975), tree shrews (Callahan & Petry, 1999), ground squirrels (Jacobs, Blakeslee, McCourt, & Tootell, 1980) and chickens (Jarvis, Taylor, Prescott, Meeks, & Wathes, 2002). A more time-efficient approach is to use a parametric representation of a sensitivity curve and modify it to fit a few key points on the sensitivity curve. Jarvis et al (2003) compare the measured sensitivity curves of different species to the model fits of the models of Barten and Rovamo and conclude that the shape of the curves are consistent to the ones modelled on the basis of human vision.
Having the confidence that the shape of the flicker sensitivity will follow human models, we use a model based on the one proposed by Frederiksen and Hess (1998). It is a physiologically inspired model that uses weighted probability summation of two responses, first from a lowpass exponential filter then a second bandpass filter, which is the second derivative of the base exponential filter. Besides being predictive of physiological outcomes, this model has an additional advantage of having a small number of parameters. To simplify the computation and the fitting, we use only the bandpass part of the filter and do the summation in the frequency domain.
The base of the model is the so-called generator impulse function of the form

and the derivatives thereof. The band pass part of the model is the second derivative of the generator impulse. Figure 1 shows the impulse and the frequency response of the base function and its second derivative.
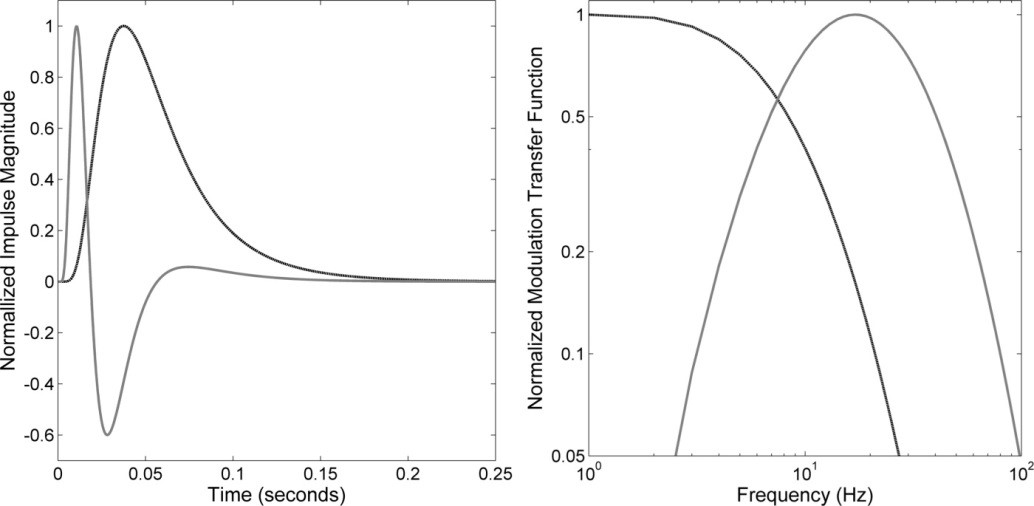
Figure 1: (a) Normalized impulse response functions and (b) their corresponding relative frequency response functions.
Given the sensitivity curve represented by the frequency amplitude response of the second derivative function h2(f) scaled by a factor S and the Fourier components of the waveform c(m) , we can compute the estimate of bird flicker visibility AFVM as

The exponent of 2 in the summation is used following the recommendation on flicker probability summation for humans given by Perz et al. (2017). The value of AFVM is a positive number that predicts the visibility of flicker. An AFVM value of less than 1 predicts that the modulation is not visible as flicker, while a value larger than 1 predicts that the modulation will produce visible flicker.
Based on the literature overview we selected the key point of the fit to be the CFF, which we define as the point where the threshold flicker amplitude equals the one of a 100% modulated square wave. As a target CFF we use the value of 150 Hz. Using a nonlinear optimization procedure in Matlab we found the parameter values that produce the target CFF while keeping the shape of the curve the same as the one for humans. Table 1 gives an overview of the fit parameters (
Based on the literature overview we selected the key point of the fit to be the CFF, which we define as the point where the threshold flicker amplitude equals the one of a 100% modulated square wave. As a target CFF we use the value of 150 Hz. Using a nonlinear optimization procedure in Matlab we found the parameter values that produce the target CFF while keeping the shape of the curve the same as the one for humans. Table 1 gives an overview of the fit parameters ( 𝜏 and 𝜎 from eq. 1, and S from eq. 2).
Table 1: Best fit parameter values
|
parameter |
value |
|
τ |
0.0295 |
|
σ |
0.376 |
|
S |
690 |
Having adapted the sensitivity curve, we can compare it to the sensitivity curve of a human (full visual field, high illuminance). Furthermore, we can explore the typical modulation of historical light sources and show their position relative to the sensitivity curve. Figure 2 shows both. Note that the temporal modulations represented by points above the sensitivity curve are not visible, and the ones below are visible.
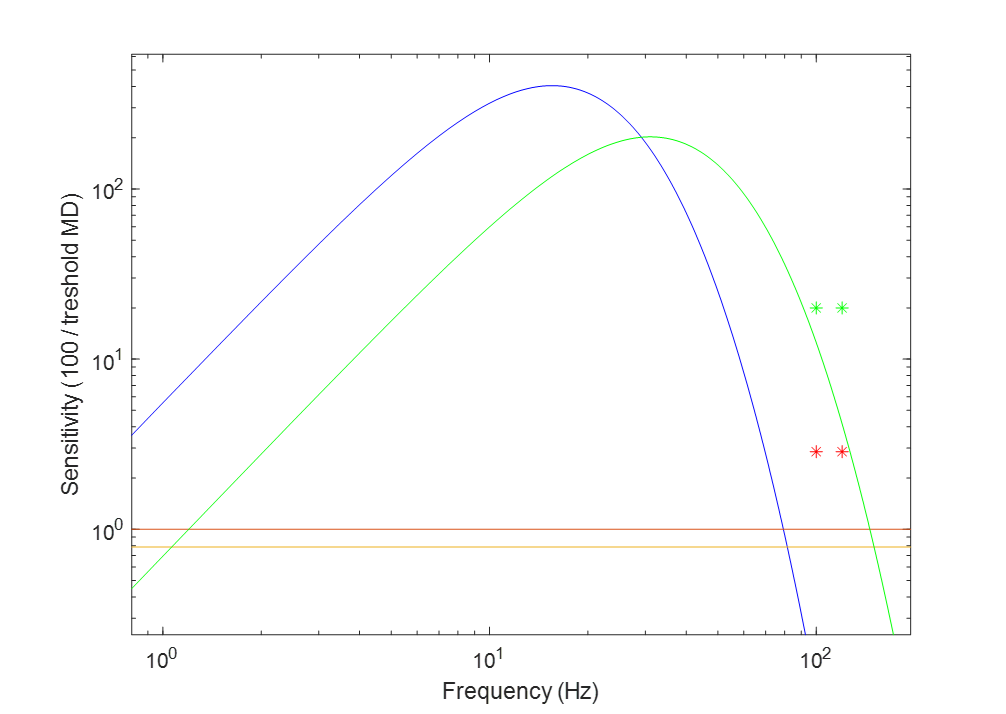
Figure 2: Flicker sensitivity of a human (blue curve) compared to a bird (green curve). The red and orange lines represent 100% sinusoidal and square modulation, respectively. The red and green stars indicate the typical modulation of florescent lights on a magnetic ballast and incandescent light.
The two light sources used as examples enable us to compare our results to some of the results reported in literature. There have been no reports of any potential visual or health issues resulting from the temporal modulation typical of an incandescent light. Our model predicts that an incandescent light waveform will not be visible. Contrary to that, low frequency fluorescent lights have been reported to be detectable and have negative wellbeing effects on some birds. Again, our model agrees and predicts that a typical modulation of a low frequency fluorescent lamp will be visible as flicker.
The presented measure tries to cover a wide range of species and possible environments all of which have a different sensitivity. However, we believe that the presented measure can be used as a first indicator of the temporal quality of light for birds, erring on the side of caution. To this end, in the development of the measure we tried to use the “reasonable worst case” of the information found in literature. Future work, especially one that targets specific species or environments, will probably use another sensitivity curve, less stringent than the one presented in our work.
4. Conclusion
The current paper proposes a measure of temporal light quality that could be used to design flicker-free light sources, as perceived by birds. It can be applied in, among others, the poultry industry to reduce the negative impact of the modulated light on chicken health and well-being.
References
CIE 2016. CIE TN 006:2016 Visual Aspects of Time-Modulated Lighting Systems–Definitions and Measurement Models. Vienna (Austria): CIE.
GRAF, V. 1973. De Lange characteristics for the fresh-water turtle Chrysemys picta picta, and the pigeon Columba livia Vision Research, 13, pp. 1815-1822
BILOTTA, J., LYND, F. M., and POWERS, M. K. 1998. Effects of mean luminance on goldfish temporal contrast sensitivity. Vision research, 38(1), 55-59.
LOOP, M. S., and BERKLEY, M. A. 1975. Temporal modulation sensitivity of the cat—I: Behavioral measures. Vision research, 15(5), 555-561.
CALLAHAN, T. L., and PETRY, H. M. 2000. Psychophysical measurement of temporal modulation sensitivity in the tree shrew (Tupaia belangeri). Vision research, 40(4), 455-458.
JACOBS, G. H., BLAKESLEE, B., MCCOURT, M. E., and TOOTELL, R. B. H. 1980. Visual sensitivity of ground squirrels to spatial and temporal luminance variations. Journal of Comparative Physiology, 136(4), 291-299.
JARVIS, J. R., TAYLOR, N. R., PRESCOTT, N. B., MEEKS, I., & WATHES, C. M. 2002. Measuring and modelling the photopic flicker sensitivity of the chicken (Gallus g. domesticus). Vision research, 42(1), 99-106.
FREDERICKSEN, R. E., and HESS, R. F. 1998. Estimating multiple temporal mechanisms in human vision. Vision Research, 38(7), 1023-1040.
HAY, K. M., MORTIMER, M. J., BARKER, D. C., DEBNEY, L. M., & Good, P. A. 1994. 1044 women with migraine: the effect of environmental stimuli. Headache: The Journal of Head and Face Pain, 34(3), 166-168.
GREEN, P. W. 1995. The effect of visual display terminal flicker on task performance (Doctoral dissertation, Texas Tech University).
PERZ, M., SEKULOVSKI, D., VOGELS, I., and HEYNDERICKX, I. (2017). Quantifying the visibility of periodic flicker. Leukos, 13(3), 127-142.
KELLY D.H. 1961. Visual response to time-dependent stimuli. I. Amplitude sensitivity measurements. J Opt Soc Am. 51:422–429
DE LANGE H. 1961. Eye’s response at flicker fusion to square-wave modulation of a test field surrounded by a large steady field of equal mean luminance. J Opt Soc Am. 51(4):415–421.
DE LANGE H. 1958. Research into the dynamic nature of the human fovea–cortex systems with intermittent and modulated light. I. Attenuation characteristics with white and colored light. J Opt Soc Am. 48(11):777–784
KELLY D. H. 1959. Effects of sharp edges in a flickering field. J Opt Soc Am. 49(7):730–732.
LEVINSON J. 1960. Fusion of complex flicker II. Science. 131 (3411):1438–1440.
SHADY S, MACLEOD D, and FISHER H. 2004. Adaptation from invisible flicker. P Natl Acad Sci USA. 101(14):5170–5173.
BARTEN, P. G. 1999. Contrast sensitivity of the human eye and its effects on image quality. SPIE press.
ROVAMO, J., RANINEN, A., and DONNER, K. 1999. The effects of temporal noise and retinal illuminance on foveal flicker sensitivity. Vision research, 39(3), 533-550.
PERZ, M., SEKULOVSKI, D., & MURDOCH, M. 2010 Chromatic flicker perception in human peripheral vision under mental load. In Color and Imaging Conference (Vol. 2010, No. 1, pp. 33-37). Society for Imaging Science and Technology.
IEC TC 77/SC 77A, “IEC 61000-4-15:2010 Electromagnetic compatibility (EMC) - Part 4-15: Testing and measurement techniques - Flickermeter - Functional and design specifications,” 2010.
TAYLOR, N. R., PRESCOTT, N. B., JARVIS, J. R., and WATHES, C. M. 2002. Can domestic fowl detect the flicker of fluorescent lights?. British poultry science, 43, S13-S14.
NUBOER, J. F. W., COEMANS, M. A. J. M., and VOS, J. J. 1992. Artificial lighting in poultry houses: do hens perceive the modulation of fluorescent lamps as flicker?. British poultry science, 33(1), 123-133.
LISNEY, T. J., EKESTEN, B., TAUSON, R., HÅSTAD, O., and ÖDEEN, A. 2012. Using electroretinograms to assess flicker fusion frequency in domestic hens Gallus gallus domesticus. Vision research, 62, 125-133.
POTIER, S., LIEUVIN, M., PFAFF, M., and KELBER, A. 2020. How fast can raptors see?. Journal of Experimental Biology, 223(1), jeb209031.
BOSTRÖM, J. E., DIMITROVA, M., CANTON, C., HÅSTAD, O., QVARNSTRÖM, A., and ÖDEEN, A. 2016. Ultra-rapid vision in birds. PloS one, 11(3)
EVANS, J. E., SMITH, E. L., BENNETT, A. T., CUTHILL, I. C., and BUCHANAN, K. L. 2012. Short-term physiological and behavioural effects of high-versus low-frequency fluorescent light on captive birds. Animal Behaviour, 83(1), 25-33.
WIDOWSKI, T. M., and DUNCAN, I. J. H. 1996. Laying hens do not have a preference for high-frequency versus low-frequency compact fluorescent light sources. Canadian Journal of Animal Science, 76(2), 177-181.
WIDOWSKI, T. M., KEELING, L. J., and DUNCAN, I. J. 1992. The preferences of hens for compact fluorescent over incandescent lighting. Canadian Journal of Animal Science, 72(2), 203-211.
RUBENE, D., HÅSTAD, O., TAUSON, R., Wall, H., and ÖDEEN, A. 2010. The presence of UV wavelengths improves the temporal resolution of the avian visual system. Journal of Experimental Biology, 213(19), 3357-3363.
BOSHOUWERS, F. M. G., and NICAISE, E. 1992. Responses of broiler chickens to high‐frequency and low‐frequency fluorescent light. British Poultry Science, 33(4), 711-717.
MOINARD, C., STATHAM, P., HASKELL, M. J., MCCORQUODALE, C., JONES, R. B., and GREEN, P. R. 2004. Accuracy of laying hens in jumping upwards and downwards between perches in different light environments. Applied Animal Behaviour Science, 85(1-2), 77-92.